


To pivot or not to pivot, that is the question. See to how Pivot tables in KNIME.
Did you know that a pivot table allows you to quickly summarize your data based on a group, pivot, and aggregation columns? This summary might include sums, averages, or other statistics, which the pivot table splits the statistics is a meaningful way for different subgroups and draws attention to useful information.
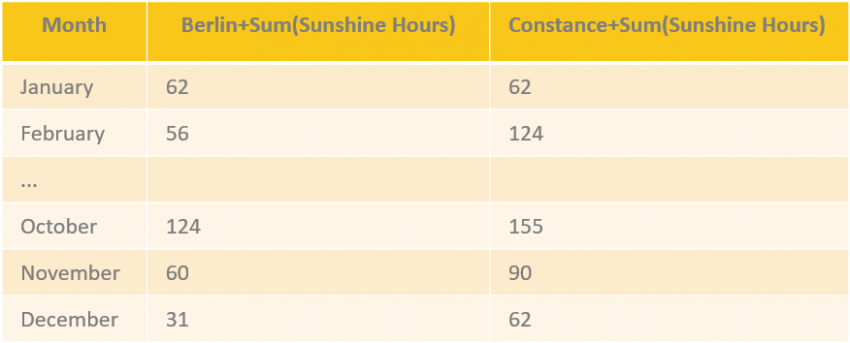
Fig. 1: A pivot table showing the average sunshine hours for each city in each month. This table was constructed by applying the pivoting function to a dataset that contains at least one column for month (group column), one column for city (pivot) and one column for sunshine hours (aggregation column).
Would you like to know more about how to use the Pivoting node in KNIME Analytics Platform? This vlog features three videos showing you how to use the Pivoting node, how to apply basic aggregation methods, such as sum and count, statistical aggregation methods, and the aggregation methods available for columns of type Date&Time. We also how to apply multiple aggregation methods to one or more aggregation columns.
So, settle down in your chair and get started with the Pivoting Trilogy, starring the Pivoting node.
Authors: Maarit Widmann & Casiana Rimbu
HUPDATA – We are the official KNIME partner in Brazil